Editor's Note: Enjoy this blog from the Custora archive, acquired by Amperity in November 2019.
One of the most important tasks for a retail CMO is to engage, serve, and increase the value of active customers. But how many actually do it?
For instance, if you’re a CMO who needs to increase the revenue from those customers who are just shy of your top 10% of spenders — let’s say they’re in the top 15–20% — where would you start? How would you know if you should focus on increasing order frequency, average order value, or average unit revenue?
In the last few years, there’s been an uptick in customer KPIs that focus on delivering value to, and deriving value from, specific customer segments. Maybe it’s core shoppers, loyalty program segments, or millennials and Gen Z. Or maybe it is, in fact, that segment that falls in that range between top-20% and top-10%.
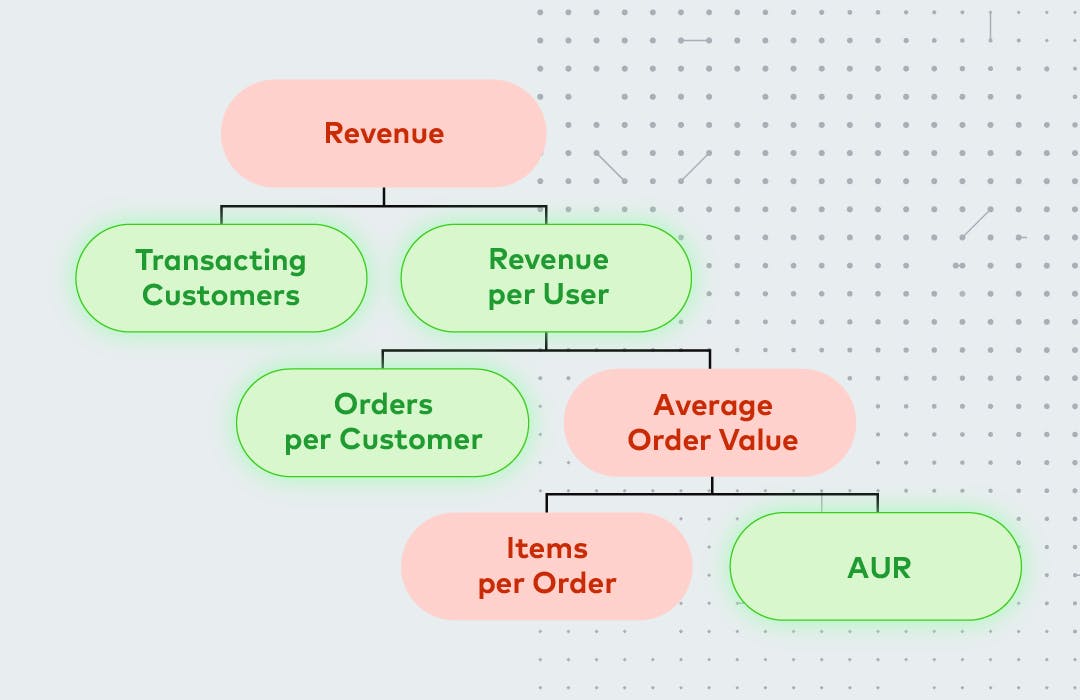
The Tree of Lifetime Value
If we approach the task by looking through a customer-focused lens, the first-order metric might be pinpointing a segment and asking, “How much revenue do we get from a segment?” That’s a good place to start, but let’s turn our attention to what I like to call the Tree Of Lifetime Value.
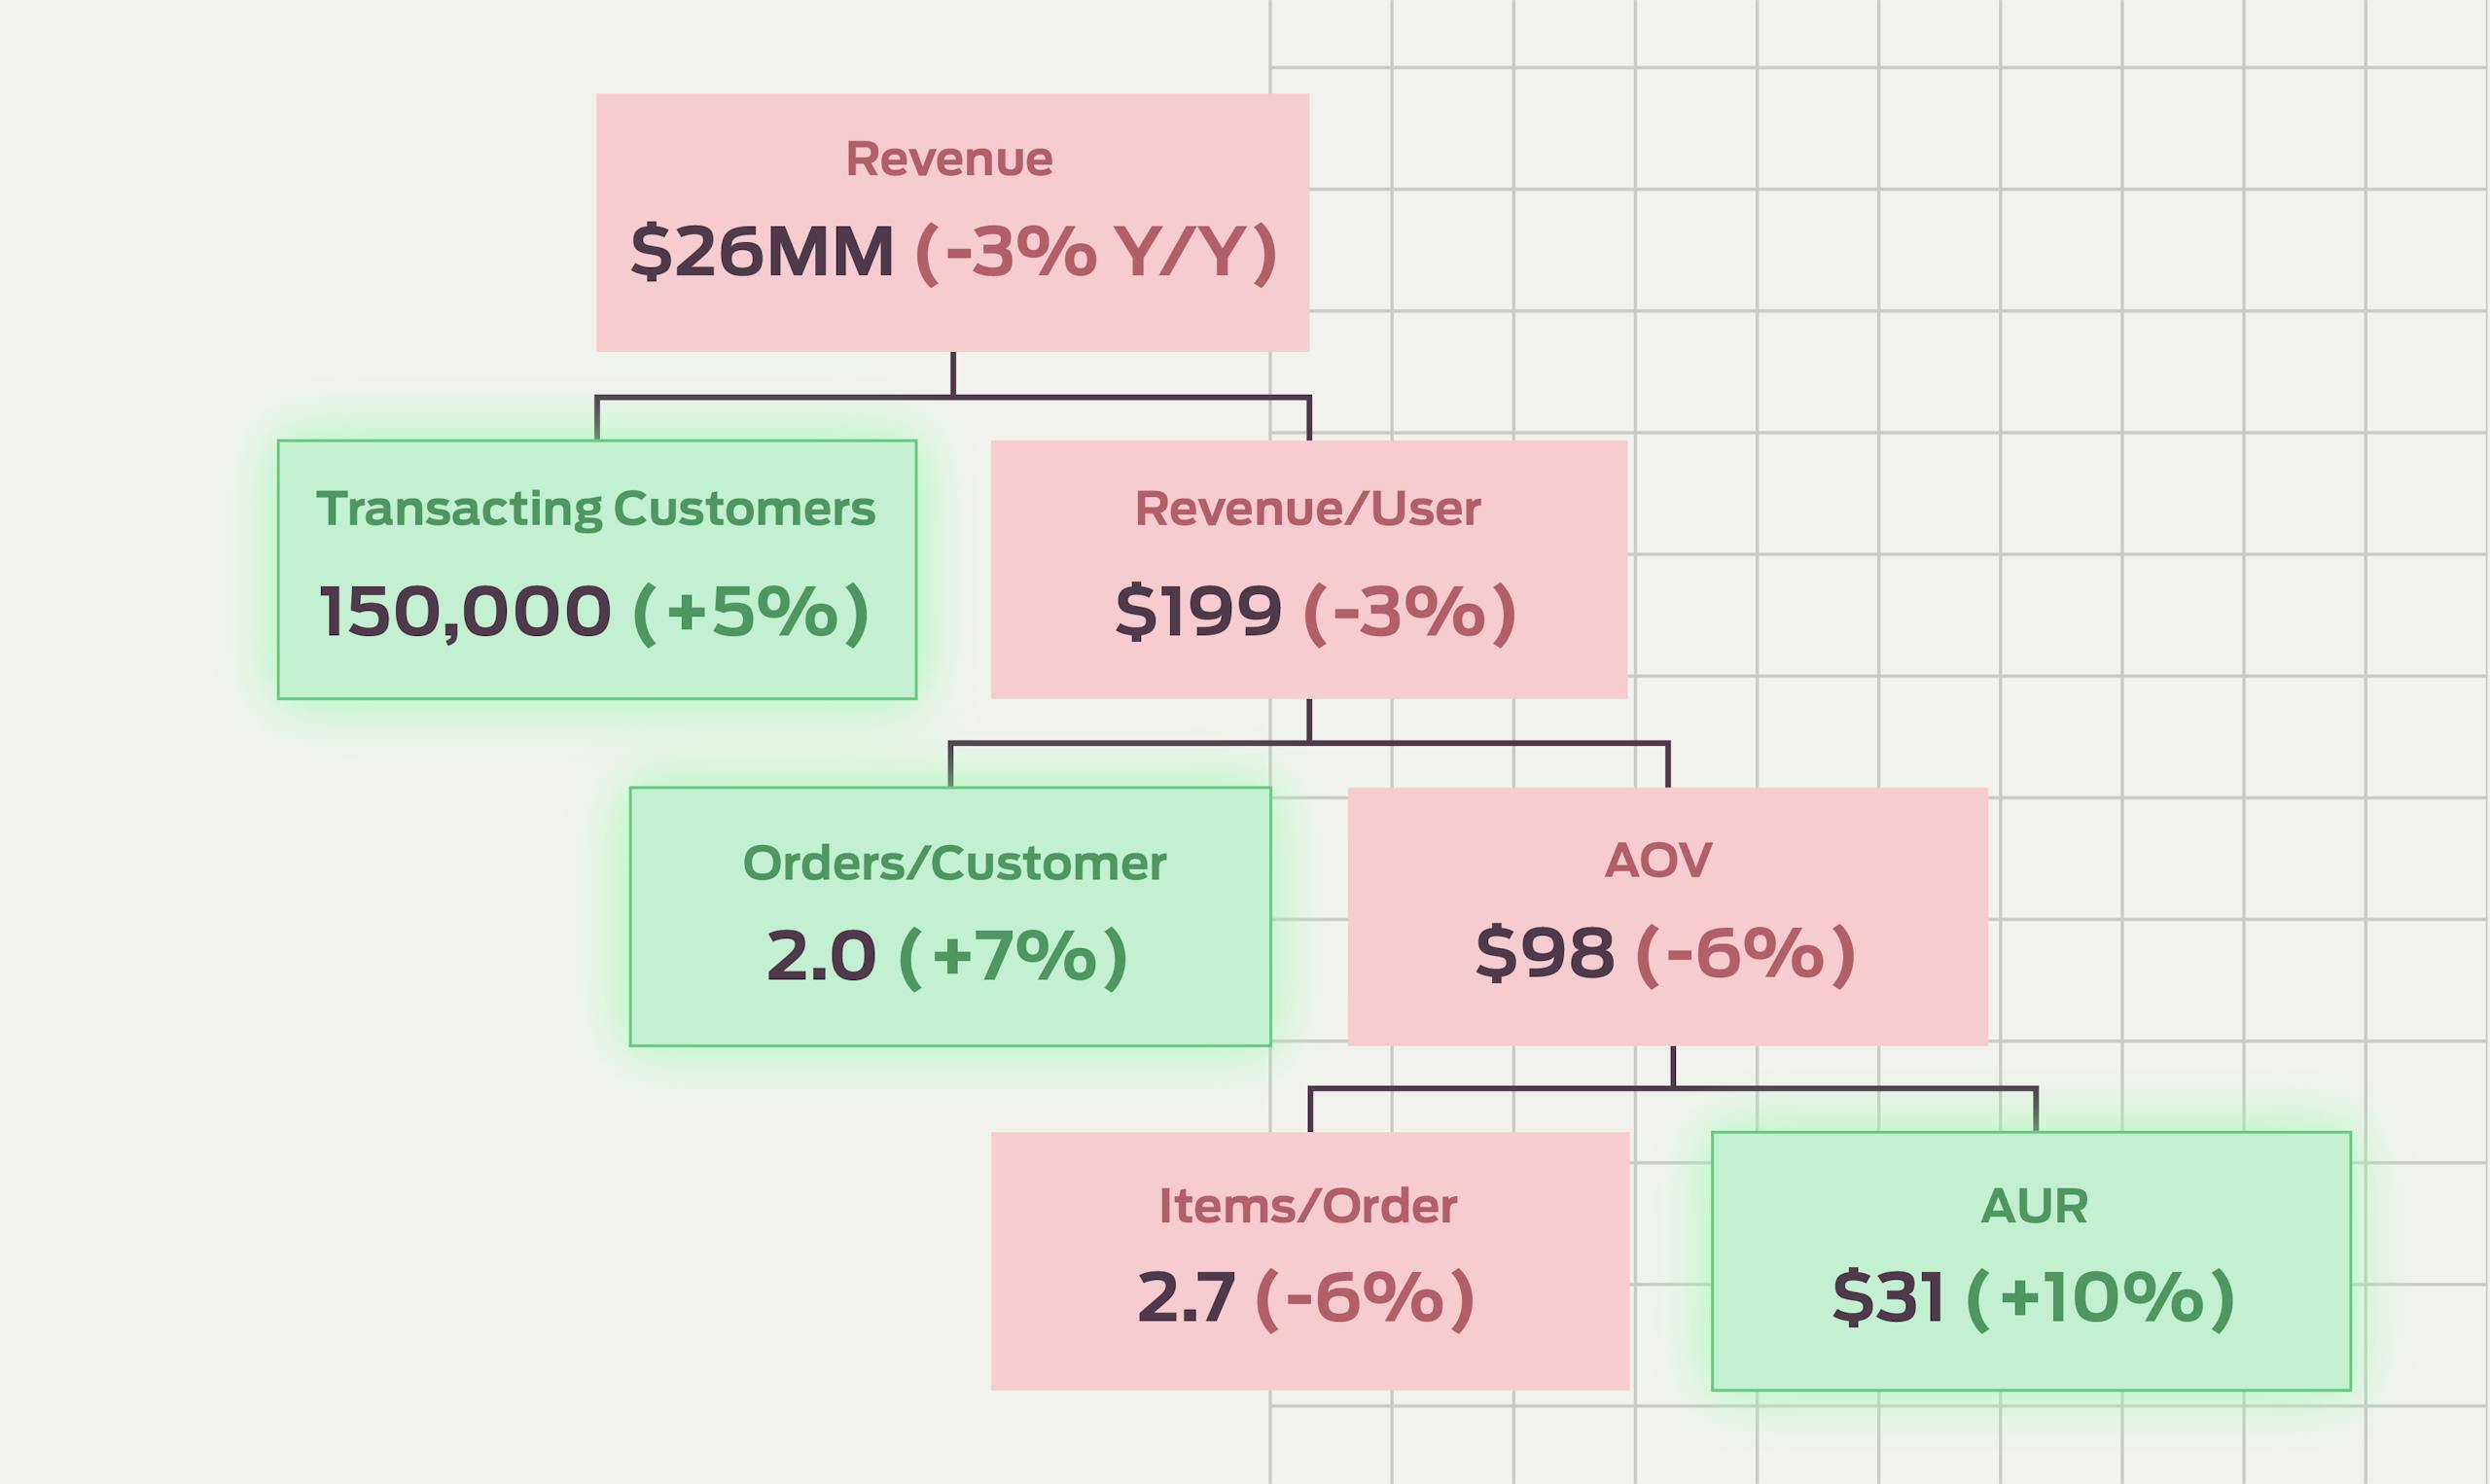
Let's say we're looking at our millennial segment and we notice that the year-over-year revenue is down. But we dig into the numbers and find we have more active millennial customers, not fewer. In fact, we have a 5% year-over-year growth.
Let’s dig down below the surface to the roots. What do we know about revenue per customer? We know it’s a function of:
How often they check out (order frequency)
The amount they spend at each checkout (average order value)
Digging that much deeper, we find that the order frequency is up a little bit this year over last year. But the average order value (AOV) is down. We know that AOV is the result of two variables:
How many items are in a customer’s cart at checkout (items per order)
What each of those items cost (average unit revenue)
Diving into a customer’s basket, we find that average unit revenue (AUR) is actually up 10% from last year. They’re actually buying more expensive stuff.
So what is going on with the sinking value of our millennial segment? We find that the root cause is actually that they’re buying 6% fewer items per order, and that trend has rippled up the tree to create a 3% YoY drop in total revenue from our millennial segment.
Find the Root and Water It
This is illustrative, but you can see that if all we're looking at is that top-of-the-tree number, that 3% drop in revenue, there’s no way to know how to fix the problem.
By doing this exercise, we not only find our weak spot, but we can see everything that we’re doing well, which is just as important. In this example, millennials are coming in more frequently and they’re buying higher-ticket items. We don’t want to make drastic changes around this positive trend with the intention of influencing the 3% drop.
Now, the main question is: What could be causing them to put fewer items in the basket? Maybe the assortment we picked this year isn't resonating with the millennial segment and that's what's driving down the items per order. Or maybe that program we ran last year — “Spend $150 and get 10% off your next order” (or whatever) — was really effective and we should start it up again. There are many possible answers to explore, but now you’re asking the exact right question, which is the most important thing.
Unearthing the KPIs that Matter Most
When we break down the KPIs of a segment like this, we get crucial information on what is happening in that segment, which leads to laser-focused KPIs and goal-setting going forward.
The promotional tactics that you use for each segment will vary as you discover weak spots. Even if a segment is growing in every possible way you will still be able to find spots that, if watered, fertilized, and analogized sufficiently, will cause rippling growth throughout the segment.
Say we’ve decided that average unit revenue is where we want to focus on within a particular segment. The first thing we want to do is talk to our finance team about promotional strategy because we’re all working together on this thing.
Then we might do some segmentation within the larger segment — and here we find two distinct groups: those who prefer, for example, high-price millennial shoes and those customers who prefer low-price millennial shoes. So now we start segmenting better and treating these two distinct groups differently to deliver on what they want, as indicated by their purchasing behavior.
The point here is to home in on the variables that are impacting your gains or your losses to see what you can most influence, how you can set goals, measure progress, and move the needle.
From Opportunity to Goal to Gold
From here, you start opportunity sizing, for instance:
If we could increase our items-per-order by x-amount, then…
If we could increase the unit price by x-amount, then...
If we could increase the number of customers by x-amount, then...
As you go through these kinds of metrics, you will find the most powerful levers in your business. You can even price out initiatives against their projected pay-offs to help you prioritize by ROI.
It’s simple to find the few “small metrics” that have the greatest effect on the top-of-the-tree “big metrics,” but it’s not simple in execution. It’s never just email marketing or just Facebook marketing. It’s never just the marketing department — the CMO needs buy-in and cooperation from Product, from Finance, from CX, and throughout the C-suite and Board of Directors. The point is to find the key metrics that mobilize the entire organization. And to do that, you have to do some digging.