
Editor's Note: Enjoy this blog from the Custora archive, acquired by Amperity in November 2019.
We've introduced Lifecycle KPIs, the Funnel of Love, and how you can use this framework to capture signals of impending customer churn before it’s too late to win them back. Having predictive analytics that can read customer behavior and warn you about “cooling off” types of behavior — any drops or hiccups in purchase frequency — introduces a new business KPI we call Churn Prevention Rate (CPR).
With new means of measurement come new approaches to optimization.
We now introduce to you the Early Repeat Rate (ERR). Optimizing on this simple measurement has the potential to double or triple your revenue from newly acquired customers.
Let’s take a step back and start from the beginning, right when customers leave the Conversion Funnel and enter the Funnel of Love.
This is the first stage of the customer relationship — the first purchase followed by that nervous interval where you reach out in the hopes of getting that second purchase. Will they or won’t they? If we keep running with our favorite dating analogy, you know that a second date increases the likelihood of a third or fourth. In the retail world, there are studies that back us up when we say that a second purchase likewise increases the likelihood of more purchases.
So, how does this work?
Starting with the basics: you know that you’re acquiring a certain amount of customers each month. You might even have a dashboard somewhere in your organization illustrating customers acquired by month and perhaps that’s subdivided into where they made that first purchase and maybe even last-touch marketing attribution.
At this point, as you well know, your job isn’t over. If customers stagnate too long in the first-purchase stage, they will ghost you. This is where our dating analogy starts to break down a bit because it’s much harder to know for certain when you, as a retailer, have been ghosted by a customer than it is for someone to know they’ve been ghosted by a date.
Which is why we have this metric called Early Repeat Rate (ERR).
We’ve said it before, and we’ll say it again: every customer purchases at a different cadence and frequency. Some buy annually. Some buy every week. But if you want to start tracking how well you’re doing in converting one-time buyers to two-time buyers, we have to settle on a metric that we can have an effect on — through marketing activities, product decisions, customer experience, etc. By narrowing the timeline to clearly define what a one-time buyer is, you can accelerate your test-and-learn tactics to figure out how to better convert those one-time buyers.
As a leading indicator, we look at the segment of new, first-time buyers and how many make a second purchase within their first 60 or 90 days, for example.
The point isn't to say that that's the total number of one-to-two-time buyer conversion. There might be plenty of first-timers who wait six months for their second purchase.
The point is to allow marketers to operate more quickly with more real-time feedback. The timeline of, say, 60 days vs 90 days, is almost arbitrary. If you’re going to effect change on a business problem, you need a leading indicator that is directionally in line with your ultimate one-time buyer rate (which can be judged on a longer timeline that is too long to wait to tweak for efficiency and effectiveness).
Without a leading indicator, the problem has a chance to fester.
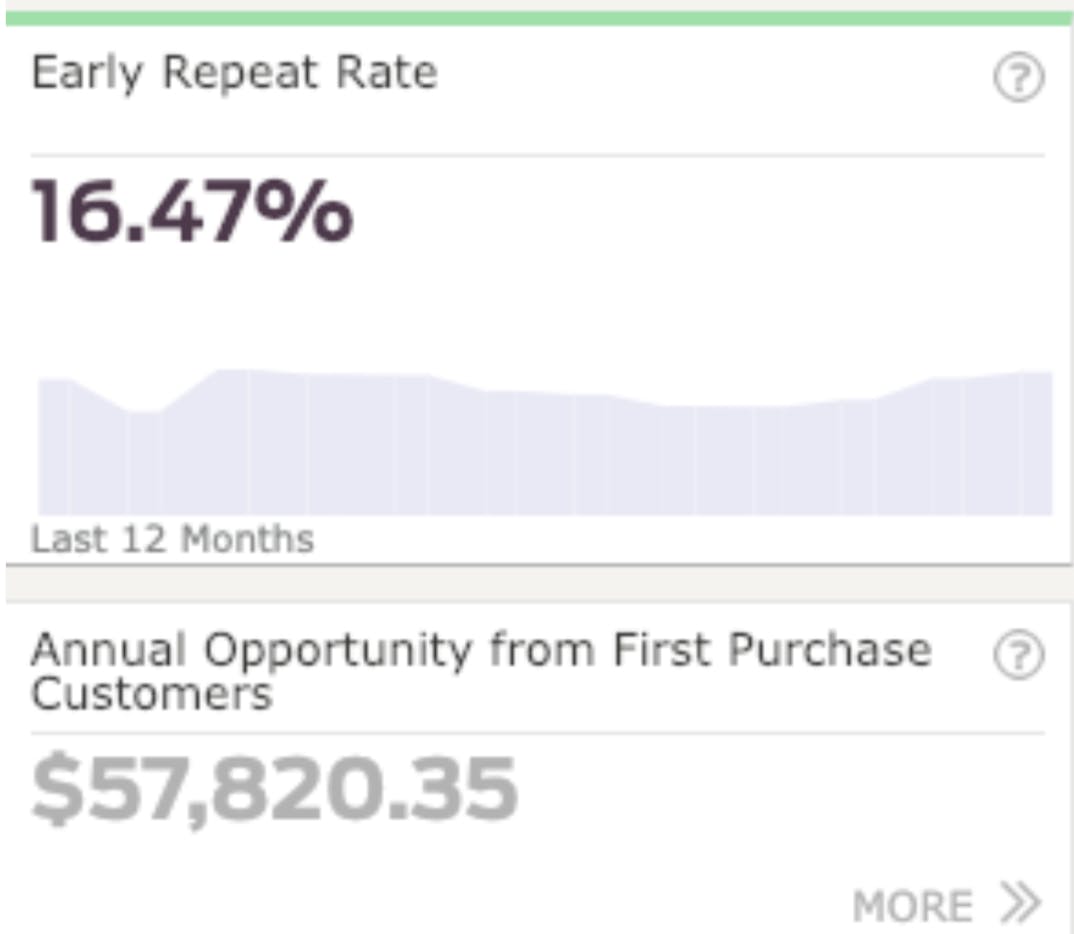
Looking at this dashboard above, given the number of customers we’re acquiring each month, and given what the conversion rate is, we can scenario-plan with these KPIs.
One interesting thing to call out here is that number is a ~$58,000 opportunity. We're using a fairly small brand as our example, but the ERR opportunity is much smaller than the $500,000 churn opportunity.
We did that intentionally, not to claim that churn prevention always provides the best return but to illustrate that opportunity-sizing is key to knowing where to prioritize. For this fictional brand with the 10x CPR opportunity, they would probably deprioritize optimizing for ERR. But it’s entirely possible that a different brand would find increasing ERR to be more valuable or easier pickings than CPR.
Opportunity sizing is mission critical because — and this shouldn’t be news to you marketers out there — though these are “marketing KPIs,” every team is accountable to the core business function of increasing customer equity.
You are making a mistake if you think that your email marketer alone is going to be able to improve your one-time buyer conversion rate or your churn prevention rate. You will be very frustrated in 12 months if you think that “right message, right time, right person, right channel” is holy writ. That “marketing equation” leaves out crucial elements that affect purchase decisions. Things like right price, right product, right assortment. Even the Four Rights are not strictly marketing.
All of these KPIs explained in this series depend on cross-functional cooperation.
Thinking about these KPIs and doing this scenario planning not only serves as a way to align the organization and track progress but it also helps with the prioritization. One of the big challenges that brands have today, with so much data and so many ways to slice it, is no one knows for certain what the hell they should be focusing on. Opportunity sizing like this allows you to overcome the mindset of just tweaking business as usual and hoping for the best.
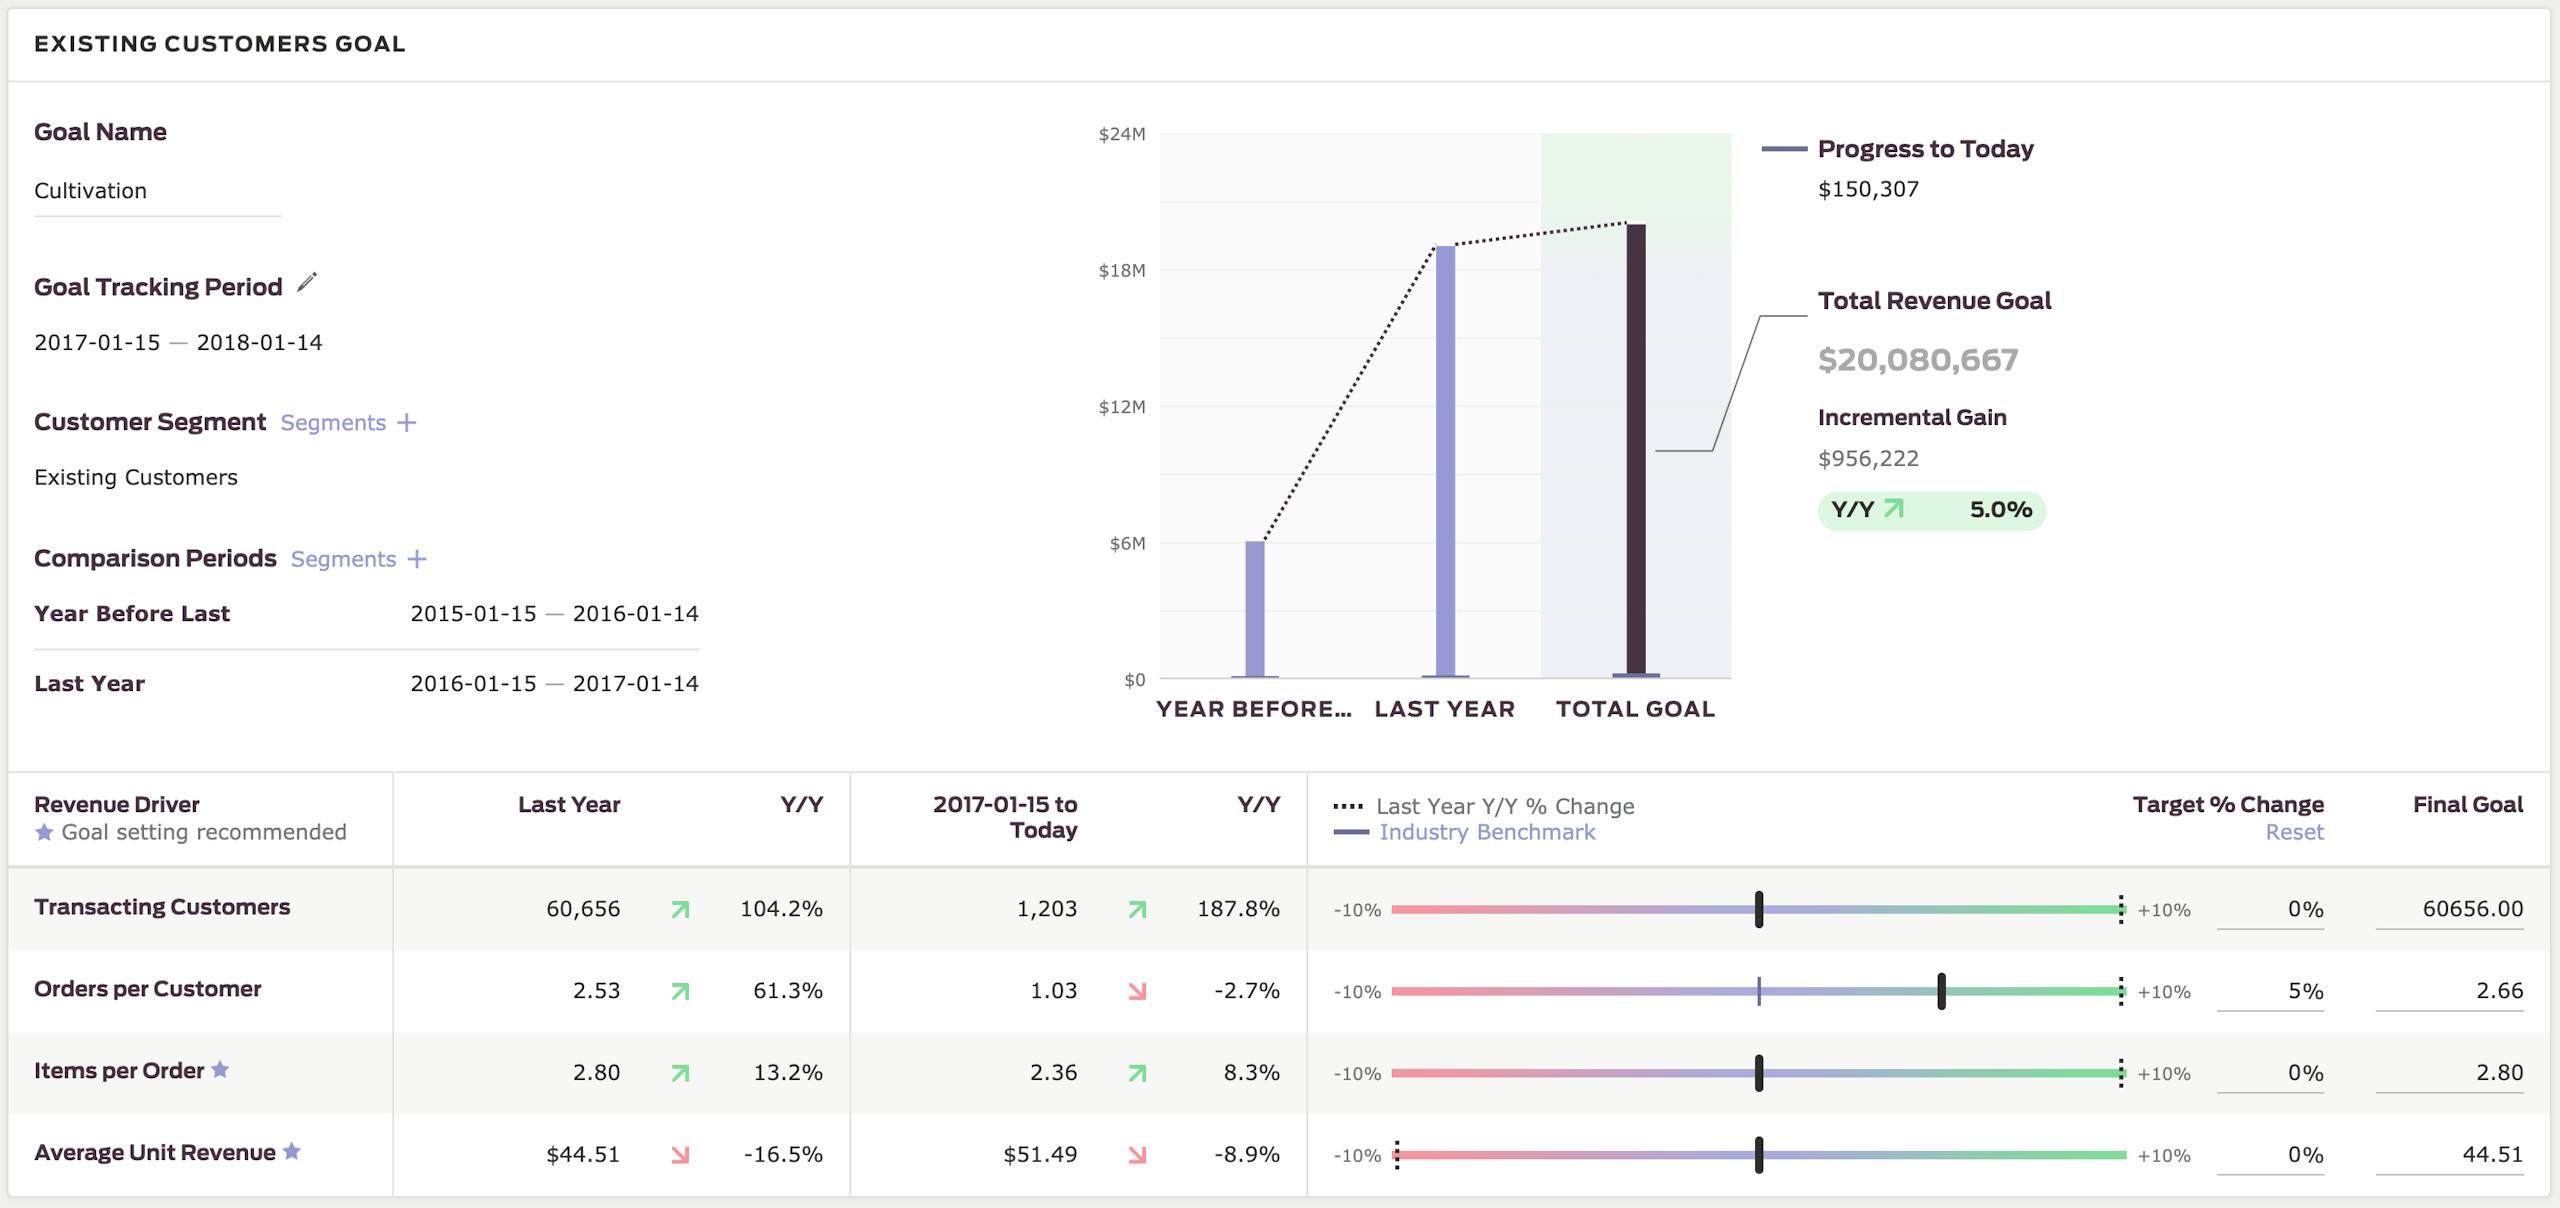
If you do this across the lifecycle, you come out with a valuable, C-Suite-level dashboard where you have the different lifecycle stages analyzed to show you how much money you might earn if improvements were made.
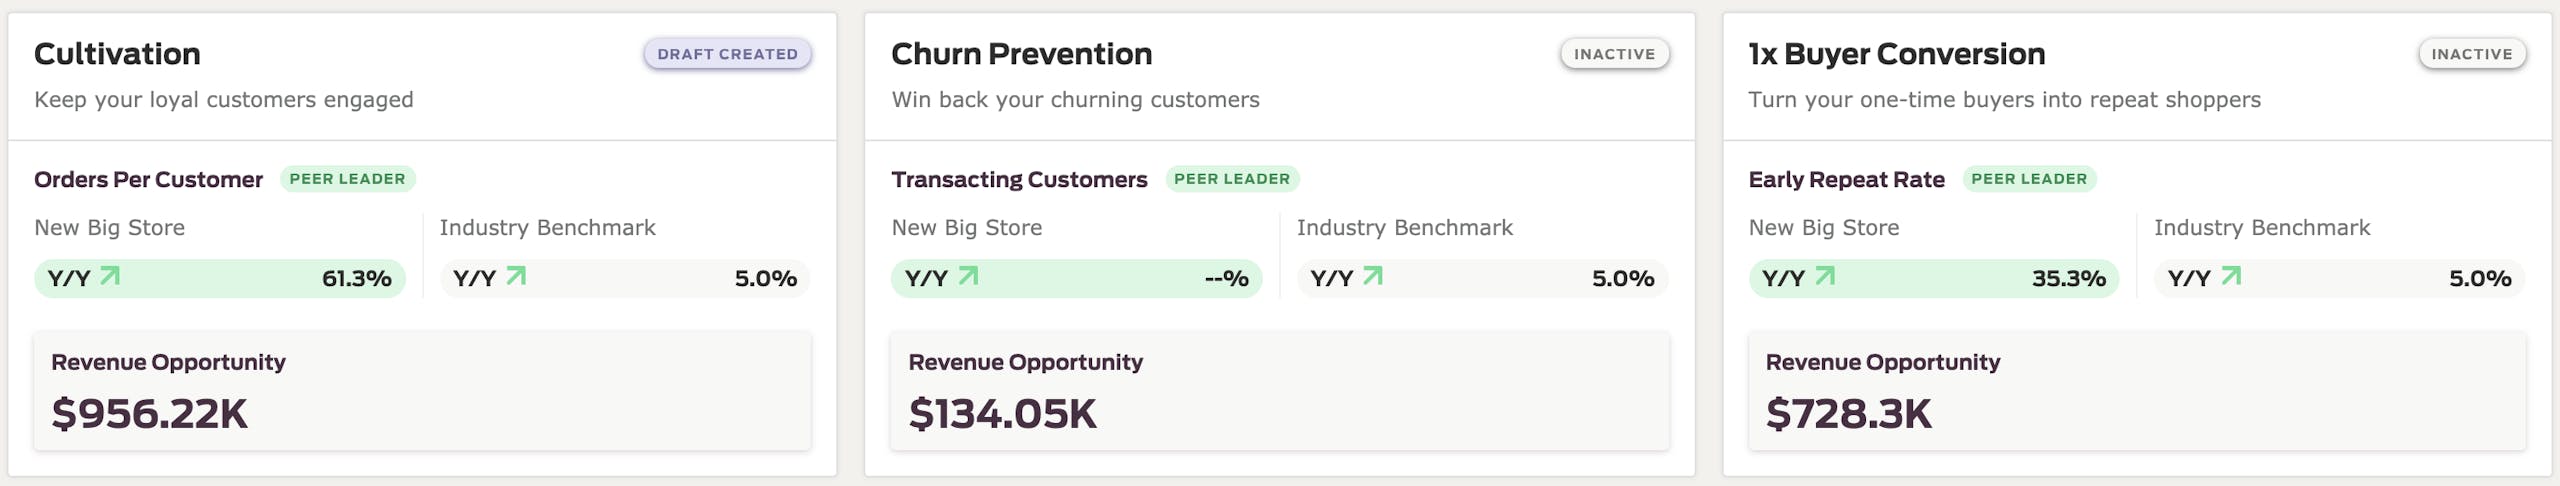
This what goal-setting can look like:
Let’s look at members — people who’ve given us their email but haven’t purchased: How well are we converting them into buyers?
How well are we converting one-time buyers into engaged, repeat customers?
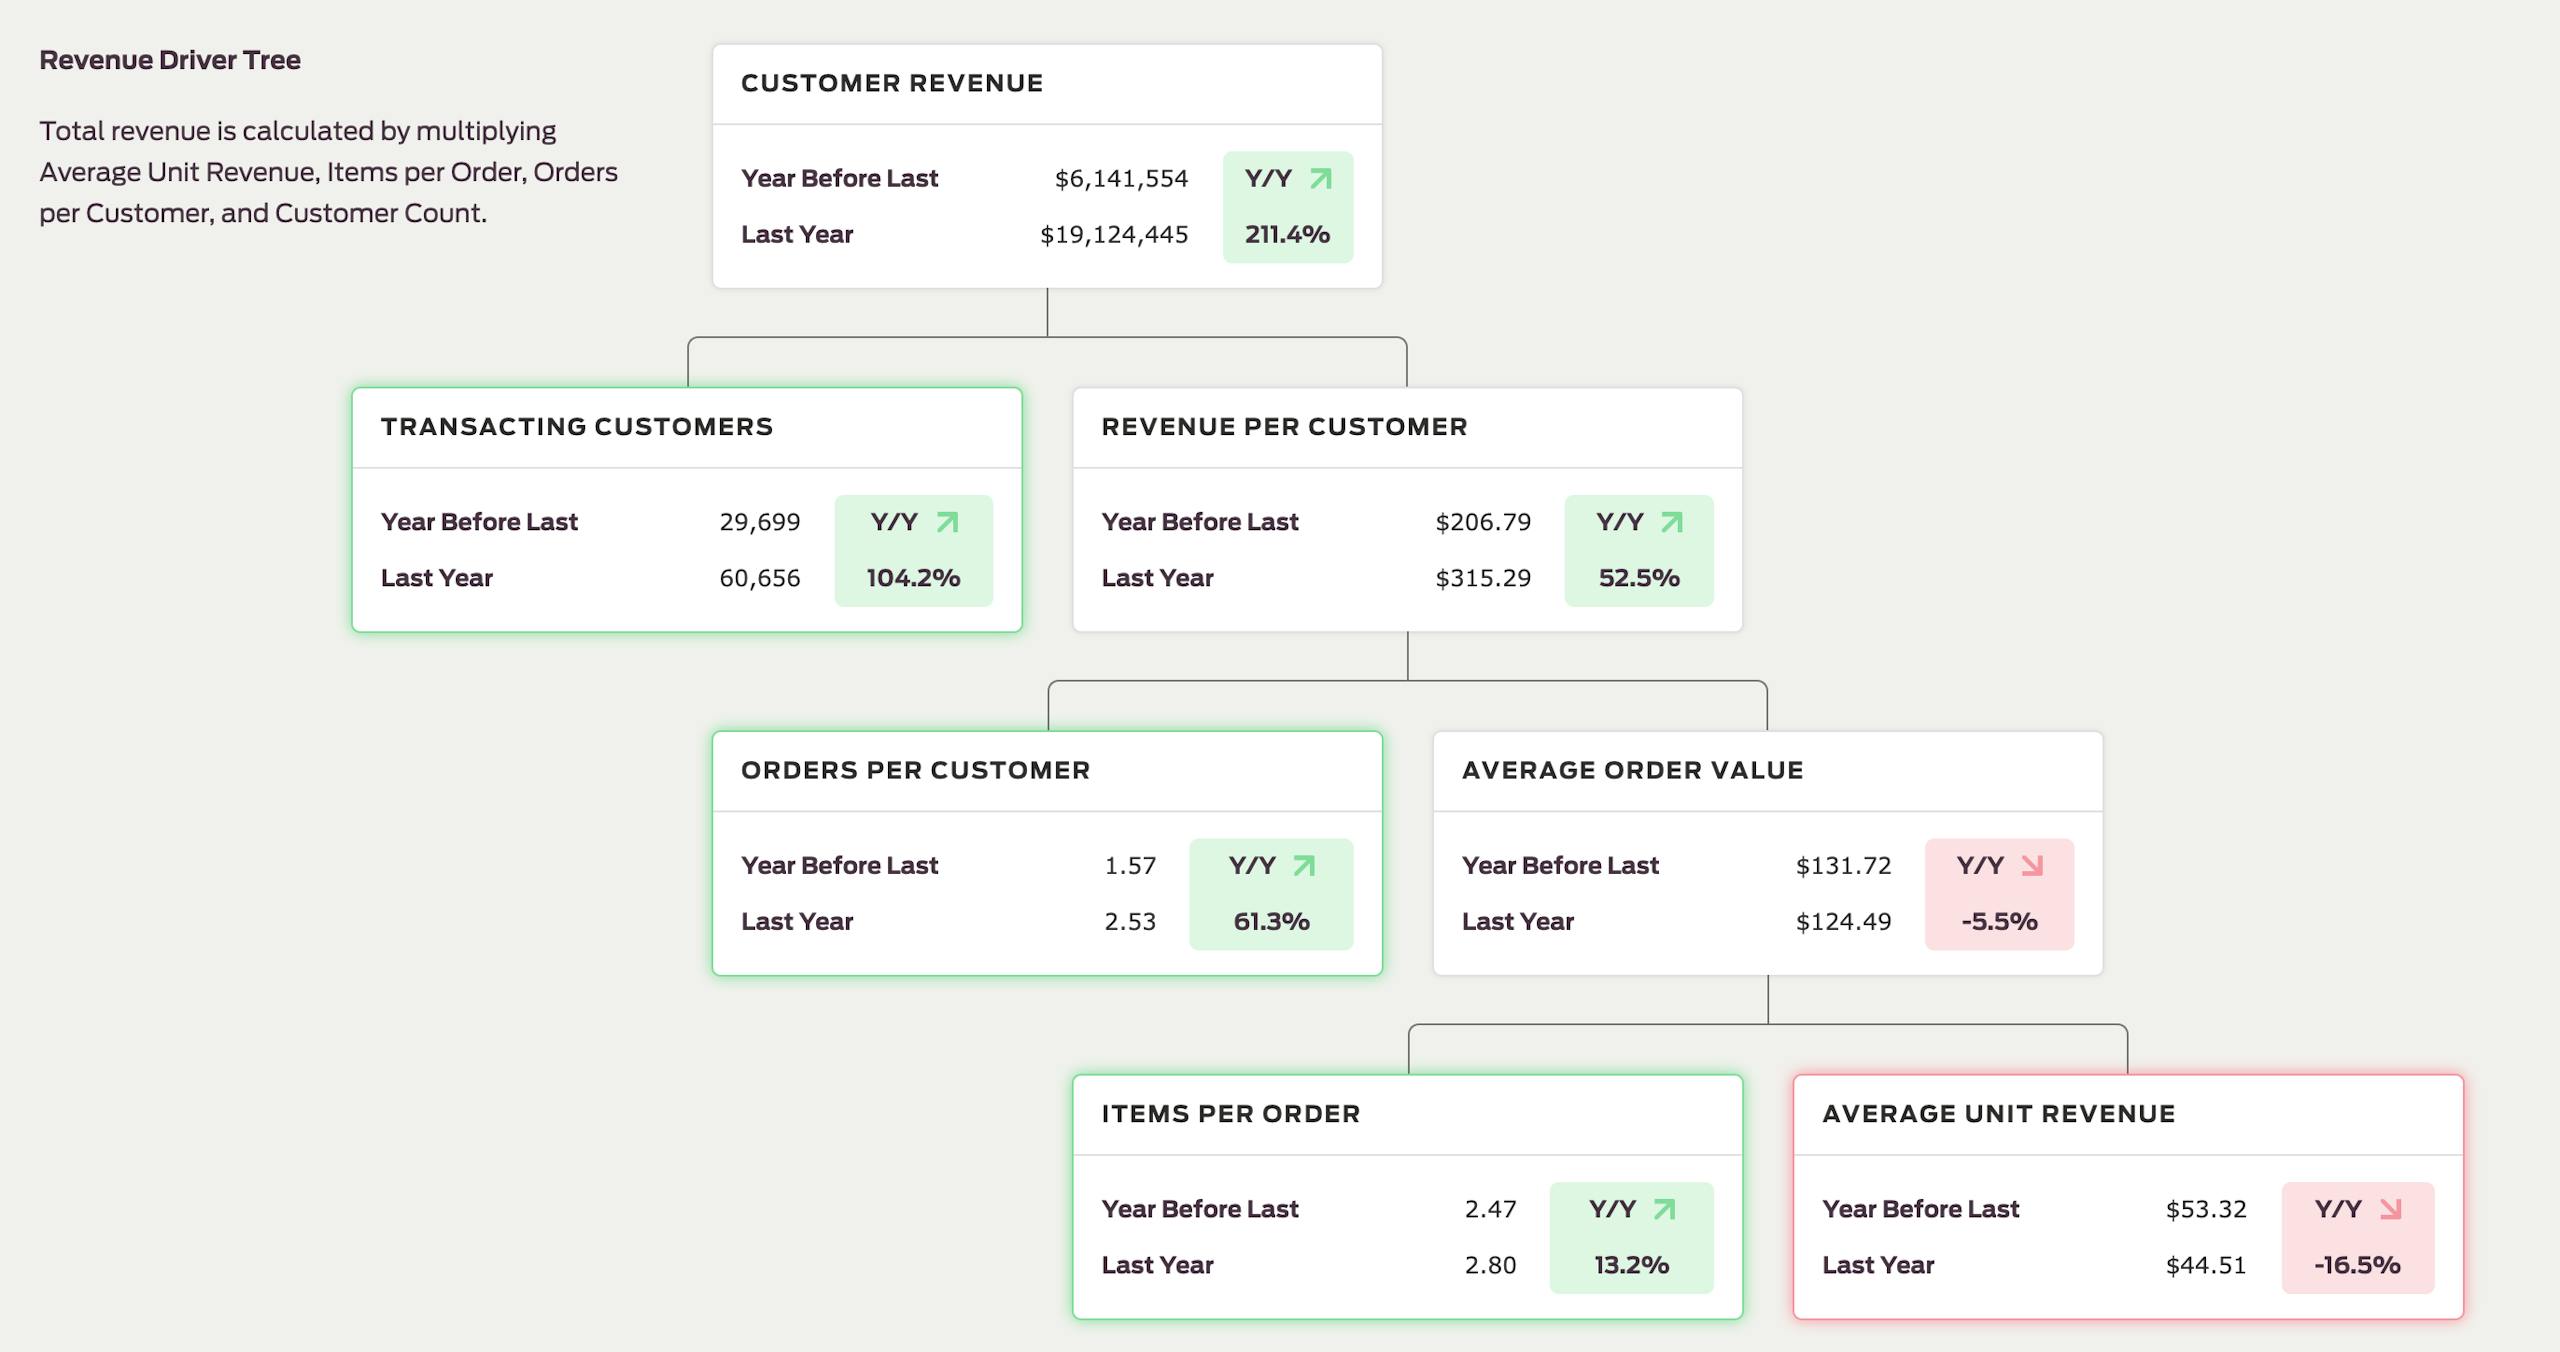
How well are we driving engagement with repeat buyers? How’s their average order value? Average unit revenue? Frequency? Basket size? Which one of those levers will provide the biggest return?
How well are we saving customers who cool down and fade away? Are we doing a good job of reactivating those who are long gone?
All these questions add up to the answer everyone in business wants to know: Where should I spend my valuable time for the most valuable return?
Answering this question is the first step in orienting the organization around which initiatives matter. Tracking your most valuable KPIs provides feedback into the variety of activities that you're going to work on, and there are more granular metrics to track against within each KPI.
Let’s go back to the opportunity landscape that we discussed earlier.
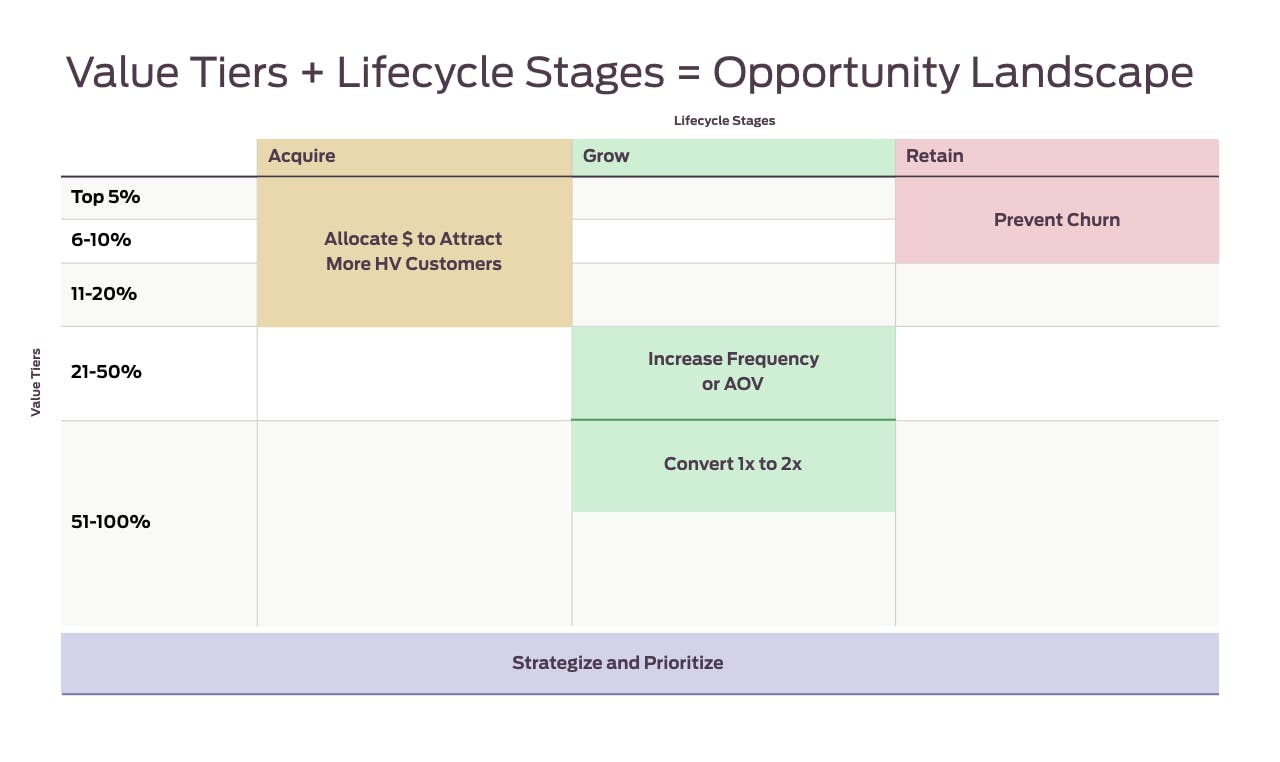
Let's start with the real-world example: generally speaking, the top 10% of customers drive ~50% of revenue for a given retail business. If that high customer lifetime value (CLV) decile is the KPI you want to optimize for, then cultivating another 1% of customers to spend like that top 10% would deliver a 5% revenue gain.
That’s ultimately how all of these KPIs operate. It's not just about having a pulse on the health of the file. It's about setting concrete goals that directly impact long-term revenue and driving growth. Unlike channel metrics that are more abstractly tied to gains or indirectly attributed to revenue, lifecycle and segment KPIs tie directly to actual business growth.
If you want to learn more about the absolute most important customer-centric KPI (spoiler alert), download our whitepaper, Predicting Customer Lifetime Value with Unified Data.