
Editor's Note: Enjoy this blog from the Custora archive, acquired by Amperity in November 2019.
When we talk about Acquisition KPIs, we’re talking about finding those matches made in heaven. How do we acquire those customers who love us? There are a number of ways to do this, but before we tackle that, let’s take a somewhat extreme example to illustrate exactly where retailers get trapped when they don’t put CLV ahead of other metrics.
This is a story about Groupon.
The story of Groupon demonstrates perfectly the fundamental flaw of channel metrics.
Groupon is an affiliate partner — once quite popular, much less so now, especially among retailers. Groupon can drive a massive amount of new acquisitions for a company, and they drive a huge amount of revenue. Say you sell t-shirts, and you want to improve acquisition, so you go on Groupon and you sell coupons for 80% off of your t-shirts. Well, you acquire tons of new customers. You sell tons of shirts. It’s a flood of new business.
But the problem is, that 80% discount ate into your margins, and maybe you even lost money for the sake of acquiring new customers. And that flood of new customers? The next time you’ll see that flock of discount hunters will be the next zero-margin sale. They don’t want you when you’re full price.
So sure, you got a lot of site visits, a lot of new customers, and a lot of revenue, but at such a steep cost that these are really just vanity metrics because it’s done no lasting good for your business.
The reality is that spending more money on a different, higher-quality channel may have generated fewer acquisitions, but those “fewer acquisitions” would’ve purchased at full price and they would be higher-frequency and/or higher average order volume (AOV) shoppers.
So the return on ad spend is smaller than your big, blow-out Groupon day, but the revenue over the course of the year from that second channel with fewer new customers is 10x what the droves of discount seekers brought in.
We like to use the analogy of fishing in the right pond, which means simply that you want to acquire customers who are a good fit for your brand. Now let’s translate that into KPIs.
Customer Lifecycle Value by Channel
The above is an example of the kind of dashboard that every single brand should be looking at but very few actually are. To get these kinds of metrics requires predictive analytics to provide longitudinal customer metrics like customer lifetime value (CLV).
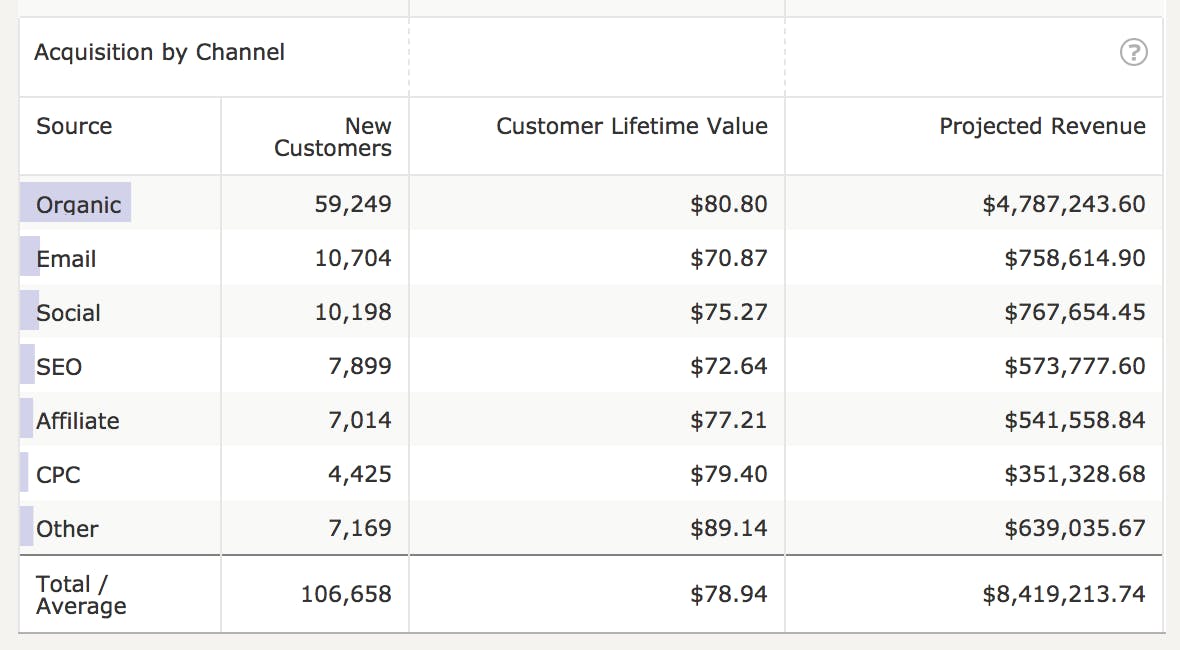
Source Column
On the left, you’ll see the source, the digital channel tagged on users.
You know when a user makes a first purchase. Your web analytics platform might not, but you do — it’s in your order database, which orders were new customer orders, which ones were repeat orders.
So coming back to acquisition:
New Customers Column
First things first, what is the volume of customers acquired? Maybe that Groupon deal-of-the-day you had did acquire a ton of customers. That is a metric that matters.
But then what's the Lifetime Value of those customers?
Short digression: Different organizations define the “Lifetime” part of Customer Lifetime Value differently — usually as a one- or two-year increment, sometimes as a three-year cycle, but for the sake of simplicity, in this example, we’ll call it a one-year lifecycle.
CLV Column
Back on topic: Looking back at this dashboard, you see this variance between the CLV and acquisition channel is very common. Every brand is different and speaks to customers differently. It shouldn’t be surprising to say that the channel matters — after all if this were pre-internet, no one would be surprised that advertising toys on Saturday morning produced greater results than advertising toys at midnight on Wednesday. But now we can measure the effect.
With email, you’re acquiring customers who will spend an average of $200 with your brand over the first year. Moving down the chart, your cost per click (CPC) campaigns — which cost more than email — are bringing in customers with an average CLV of $150. That’s a 25% difference without even considering customer acquisition cost (CAC).
Projected Revenue Column
The final column is projected revenue, which is simply the number of new customers multiplied by the predicted CLV. This makes it incredibly simple to see which channel brings in the most revenue. The extra leap in the Acquisition KPI is to compare Projected Revenue by Channel after you subtract total CAC per channel. Now you know the total customer equity acquired this month and you know the customer equity by channel.
This number isn’t just useful for marketing managers trying to maximize ad spend but can directly feed into budgeting decisions all the way at the top of the organization.
Are Your Acquisition KPIs Good-Decision Drivers
Going back to Acquisition KPIs, imagine you have a drill-down dashboard like this, and you have your CPC team looking at keywords by the CLV of customers each acquires. Seeing the customer acquisition cost in the context of customer lifetime value and customer equity makes decision-making across channels so much easier. Which affiliate partners deliver the highest CLV and which ones bring in the highest predicted annual revenue? What about by social campaign? Email segment? On and on, your acquisition efforts are framed not by the short-sighted metrics of cost, but by the long-term view of value.