The most sophisticated analytics teams see their job as not only measuring the health of the customer file, but delivering the right recommendations on how to grow customer lifetime value. What are these teams doing differently?
Quick summary:
There are things to measure besides total revenue or revenue per customer, which can give you a fuller picture of what’s causing problems and where you have opportunities.
Organizing your data in a ‘revenue driver tree’ helps you break it down into more specific categories so you can pinpoint why your top-line numbers are rising or falling.
With precise insights that spur effective action, analytics teams can take on an important strategic role.
Analytics teams often face daunting hurdles in collecting, centralizing, and cleaning customer data for analysis. With time and resources at a premium, these teams must quickly move from “what happened?” to “what do we do about it?”
Many of the best teams use a simple but extremely powerful framework for understanding the drivers of customer economics.
For instance, if you’re an analytics leader tasked with reporting on customer health trends among members of the loyalty program, you might start by looking at metrics like total revenue and revenue-per-user associated with program members.
That’s a great starting point. But when you think about it from the perspective of the marketer or loyalty program manager tasked with the program P&L, it opens up a raft of questions. Why are your numbers up or down? And if you want to improve, which of many potential levers of customer behavior – increasing order frequency, average order value, or average unit revenue – should you focus on?
The Revenue Driver Tree
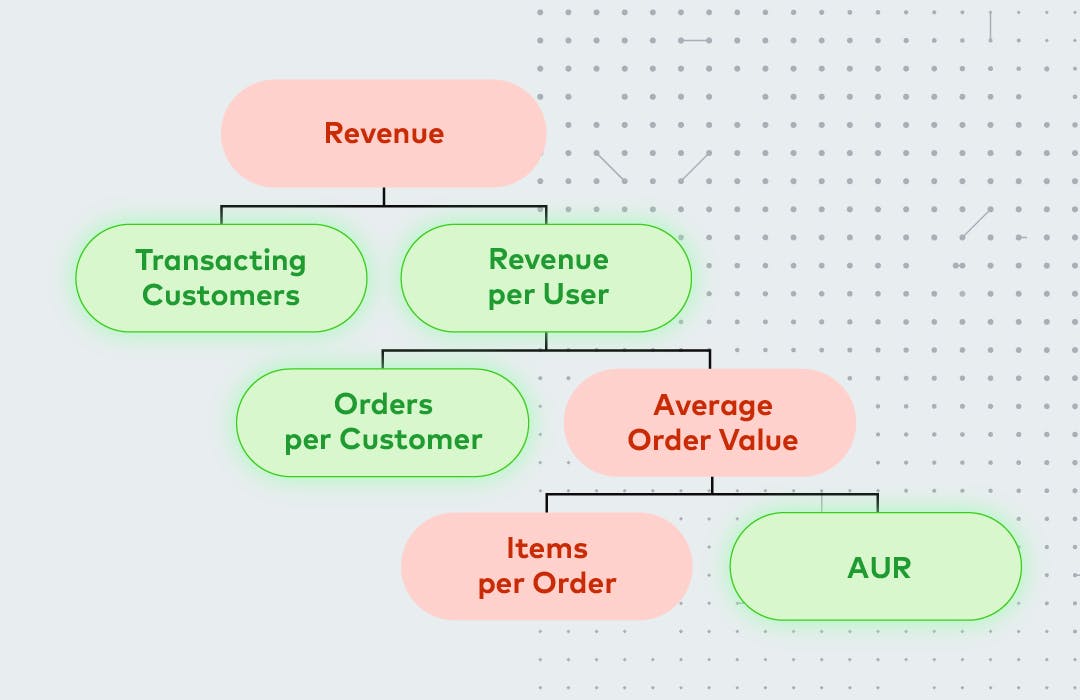
One framework often used by analytics leader is a revenue driver tree: a way of systematically parsing a high-level segment metric (e.g., total revenue) into the most granular drivers of customer behavior.
This example uses retail-specific concepts (like “items per order”) – but there’s a useful version of the revenue driver tree for every industry. In fact, the tree is often more complex outside of retail. An airline, for example, might break out revenue by customer into a few buckets:
Credit card spend
Airfare
Auxiliaries (bag fees, paid upgrades, premium beverages)
Going back to our retail example: let's say we're looking at our loyalty membership segment and we notice that the year-over-year revenue is down. But when we delve into the numbers, we find that we have more active loyalty members, not fewer. In fact, we have a 5% year-over-year growth.
Let’s dig down below the surface to the roots. What do we know about revenue per customer? We know it’s a function of:
How often they check out (order frequency)
The amount they spend at each checkout (average order value)
Digging that much deeper, we find that the order frequency is up a little bit this year over last year. But the average order value (AOV) is down. We know that AOV is the result of two variables:
How many items are in a customer’s cart at checkout (items per order)
What each of those items cost (average unit revenue)
Diving into a customer’s basket, we find that average unit revenue (AUR) is actually up 3.4% from last year. They’re actually buying more expensive stuff.
So what is going on with the sinking value of our loyalty membership segment? We find that the root cause is actually that they’re buying nearly 11% fewer items per order, and that trend has rippled up the tree to create a 2% YoY drop in total revenue from our loyalty membership segment.
Identify and Address the Root Cause
The revenue driver tree helps us quickly move from high-level trend analysis (the 2% drop in revenue) to specific and informed hypotheses about root cause.
By doing this exercise, we not only find our weak spot, but we can see everything that we’re doing well, which is just as important. In this example, loyalty members are coming in more frequently and they’re buying higher-ticket items. (We don’t want to make drastic changes around this positive trend with the intention of influencing the 2% drop.)
Now, the main question is: What could be causing them to put fewer items in the basket? There are a number of possible hypotheses to explore:
Changes in shipping threshold (did we lower the minimum order requirements for free shipping?)
Changes in site or store merchandising strategy (did we miss out on an opportunity to cross-merchandise categories or products that would typically be bought in a single transaction?)
Changes in loyalty points accrual policy (did we intentionally or inadvertently incentivize smaller, more frequent purchases?)
Changes in product assortment (did we lower our exposure in low-price point “impulse purchase” categories that typically get bundled with larger purchases?)
The most common strategies to validate a hypothesis – and actually pinpoint the root cause – would be to:
Compare the revenue driver tree before and after key company actions (e.g., website relaunch, change to shipping threshold, change in commission rate of channel partners)
Create a revenue driver tree for different segments (e.g., loyalty members vs. non-loyalty members, or high-value customers vs. lower-value customers) and compare
Unearthing the KPIs that Matter Most
Breaking down the revenue drivers of a segment like this furnishes crucial information on the root cause of behavioral changes in that segment – and enables analytics teams to play a leading role in measuring the impact of everything from channel strategy to merchandising assortment, competitive tactics, and promotional cadence.
Ultimately, analytics teams that embrace the revenue driver tree framework take on a critical role as business strategy leaders: not just describing what happened, but prescribing how to maximize customer lifetime value moving forward.
Want to talk more about finding little pockets of big opportunity? Get in touch.