
Editor's Note: Enjoy this blog from the Custora archive, acquired by Amperity in November 2019.
Lifecycle KPIs are similar to segment KPIs, just with different parameters.
Brands think a lot about the customer lifecycle when they become truly concerned with driving growth by looking at the health of their business through the lens of lifetime value.
The customer lifecycle tracks the stages in your relationship with a given customer. It’s not unlike the familiar conversion funnel — only it’s post-conversion — which is why, just for fun, we’re going to refer to it as the Funnel of Love.
The Funnel of Love starts during the conversion funnel. It starts with becoming a Member, as we call it, which refers to those people who have given you their email address, either for a newsletter, a discount that they haven’t acted on yet, or whatever. The real fun starts when they make their first purchase, which is where they leave the conversion funnel and fully enter The Funnel of Love as Active Customers.
Once in the Funnel of Love, customers might stagnate as One-Time Buyers and flush out to Churned before any real magic happens. Or they might stick around, as high-frequency, high-value shoppers. Or they might fall somewhere in between. But eventually the love will fade, and with it the customer’s loyalty, and they’ll exit through the Churn Hatch at the bottom of the funnel.
Examining your brand’s Funnel of Love in dashboard form, you might have a distribution that looks something like this:
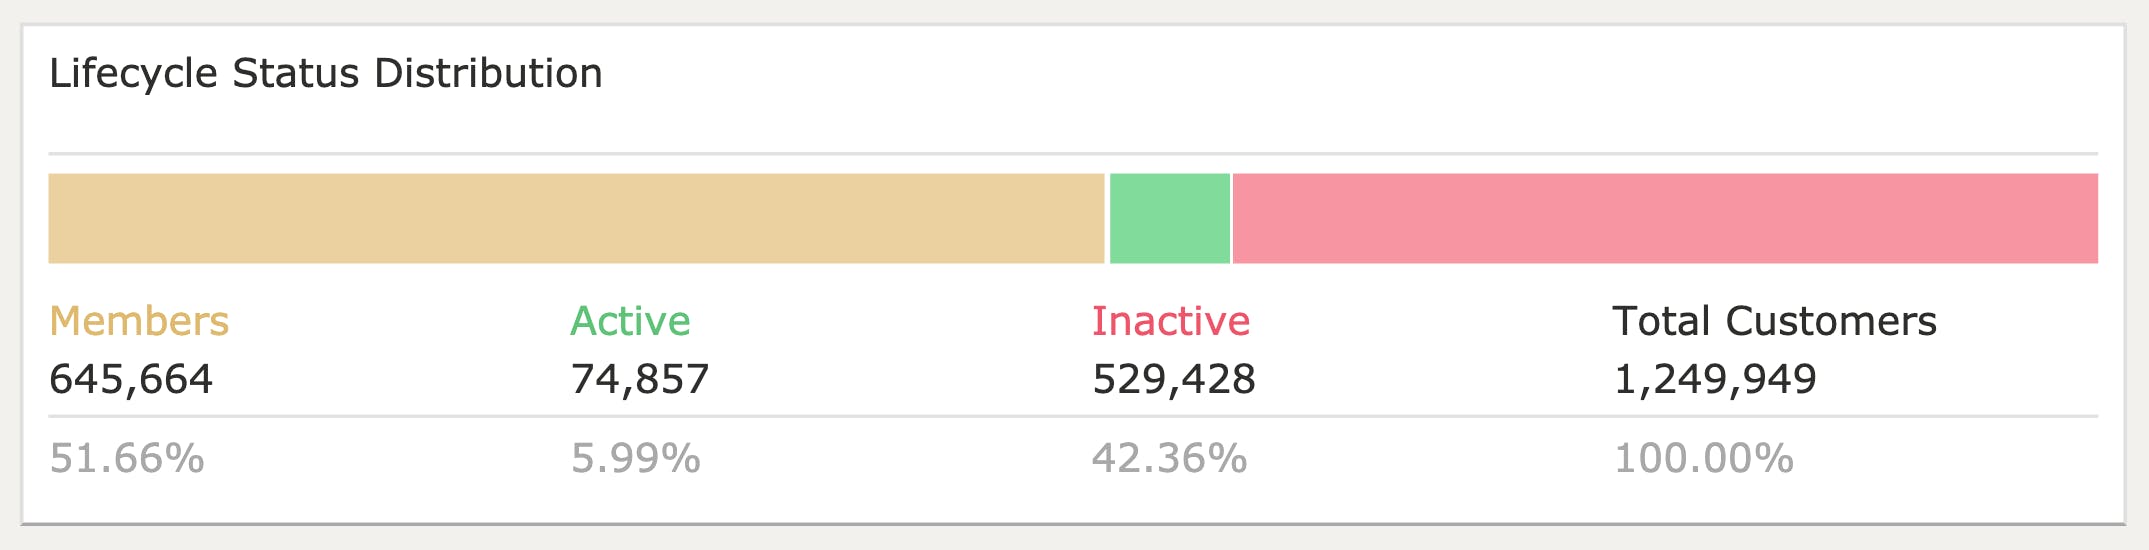
For each segment of customers that occupies a given stage of the lifecycle, you have different behaviors you want to influence in different ways. You want your Members to make their first purchase, you want to increase the value of your Active Customers and you want to reactivate Churning and Churned (a.k.a Inactive) Customers.
When we start talking about Lifecycle KPIs, the first place we like to start is how to determine whether a customer is active or inactive. The most common practice we see among retail brands is rules-based, something like a 12-month or 24-month dormancy to determine inactivity.
That’s a start. It’s better than many companies who don’t even go that far. But you can do better.
If you look at the behavior of your Active Customers, you’ll notice that there are customers who buy once a week, some who buy once a month, others who buy once a quarter, and then some who buy only once a year.
Using predictive analytics, you can create a system that detects on-cycle and off-cycle customers in a way that’s tailored around their buying behavior.
That would be the most basic thing to do right up front to improve lifecycle reporting, but you can go deeper.
As we said, the Funnel of Love ends with Churn, but right before Churn is the Cooling Down period.
Every brand in the history of mankind has had customers who churned, and churned customers are difficult to win back.
Cooling customers, however, don’t require quite as much encouragement.
If you knew who was leaving the party before they left, you’d have an easier time convincing those people to stay than you would convincing everyone who was already in their cars to come back.
We often turn to the example of the top 10% of customers who drive half the revenue. For one brand we worked with, a full half of those customers were churning out every year. That means they were losing 25% of their revenue per year and forced to rely on acquisition and cultivation to make up the difference. But retention can be so much easier.
You start looking at how well you’re doing at saving customers. Later we’ll get into how to keep customers out of the Danger Zone, but for now, let’s focus on what to do once they’re there. How well are you doing at saving them?
First things first: you find a KPI for that. So…
Of our customers who are in trouble, how many do we save?
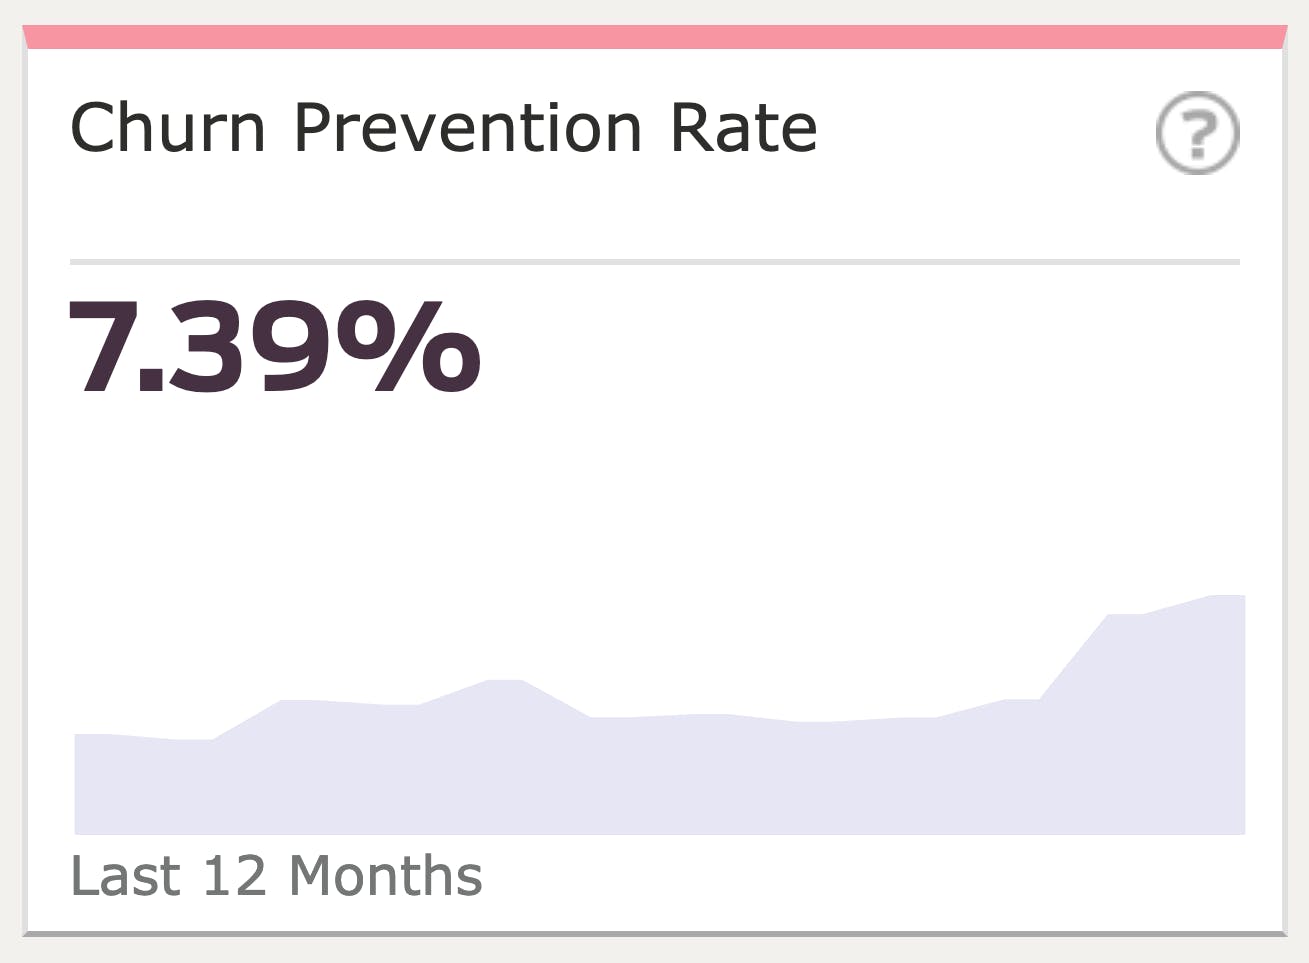
When you have in place predictive analytics that can alert you when customers are in the Danger Zone — whether that’s by leveraging your internal data science team or a partner like Custora — you can then experiment with reactivation campaigns and measure success, which we call Churn Prevention Rate. It’s a happy, pun-derful coincidence that the abbreviation for this is CPR, because this is where you are trying to prevent the termination of a customer lifecycle. Easy mnemonic, right?
Anyway, looking at the dashboard example, let’s say your CPR is 7%, which means that of all of the customers who enter the danger zone, you’re able to save 7% of them. What happens if you improve that? What happens if you get a relative 5%, 10%, 15% difference?
This is something that you can opportunity size, as you see below.

In this scenario, you know how many customers enter the Danger Zone each month. You know how much those customers spend per order. You can multiply them together and see how much in dollars an x-percentage improvement will bring in on a monthly and annual basis.
But this is conservative because it assumes that customers brought back to life will continue to purchase at their typical cadence — but when you’re a power-KPI user, your cultivation strategy could lead them to buy at a higher value or higher frequency after your CPR campaign.
The point here is to show the value of not just choosing a more precise KPI but also to look at the monetary value of the gains you’re looking to achieve, which makes the goal much more meaningful to the organization.
Once you have that KPI with a dollar amount attached to it, you can start running a variety of CPR tactics to test, learn, optimize, and finally reach goals in terms of both churn prevention rate and year-over-year revenue.